Tauriga Sciences, Inc Updates and Standardizes the Packaging of its Tauri-Gum Blister Pack

[ad_1]
The Blister Pack Design has been Updated for All 6 Tauri-Gum™ Flavors and Now Includes Halal Certification Icon, QR Code, and Other Features
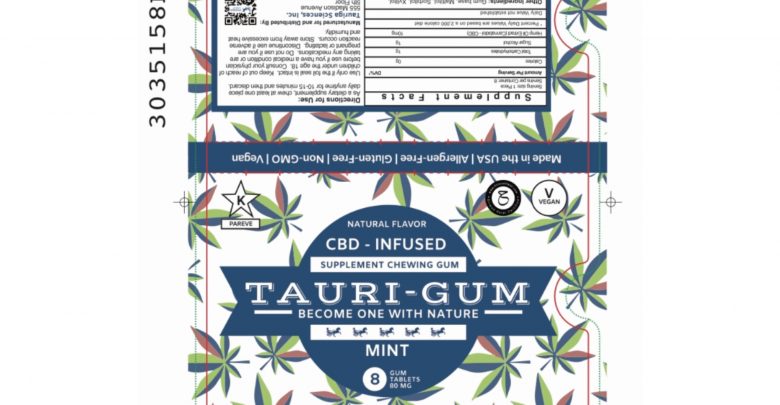
NEW YORK, NY –  (NewMediaWire) – October 15, 2020 – Tauriga Sciences, Inc. (OTCQB: TAUG) (“Tauriga” or the “Company”), a revenue generating, diversified life sciences company, with a proprietary line of functional “supplement” chewing gums (Flavors: Pomegranate, Blood Orange, Peach-Lemon, Pear Bellini, Mint, Black Currant) as well as two ongoing Biotechnology initiatives, today announced that is has updated and standardized the Blister Pack (“Sleeve”) design(s) for all 6 of its Tauri-Gum™ flavors. This updated Sleeve design incorporates all of the progress that the Company has made, since the initial launch of its Mint flavor Tauri-Gum™ during March 2019. Since then, the Company has obtained additional Certifications (such as Halal) and gained compliance with the rules and regulations of a number of different U.S. States and Jurisdictions. As part of this press release, there is an embedded image that depicts the updated Sleeve design for Mint flavor, Cannabidiol (“CBD”) infused, Tauri-Gum™.
The Company completed this important initiative, in response to detailed discussions with major national retail chains as well as regional distributors. The Company is very pleased with the progress being realized, with respect to its National product launch, and will continually update its shareholders with respect to material events.
In other news, the Company continues to generate strong results in its highest margin E-Commerce business segment. The September 2020 launch of its Rainbow Deluxe Sampler Pack (“Rainbow Pack”) is expected to drive growth during this quarter and beyond.
ABOUT TAURIGA SCIENCES INC.
Tauriga Sciences, Inc. (TAUG) is a revenue generating, diversified life sciences company, engaged in several major business activities and initiatives. The company manufactures and distributes several proprietary retail products and product lines, mainly focused on the Cannabidiol (“CBD”) and Cannabigerol (“CBG”) Edibles market segment. The main product line, branded as Tauri-Gum™, consists of a proprietary supplement chewing gum that is Kosher certified, Halal certified, and Vegan Formulated (CBD Infused Tauri-Gum™ Flavors: Mint, Blood Orange, Pomegranate), (CBG Infused Tauri-Gum™ Flavors: Peach-Lemon, Black Currant) & (Vitamin C + Zinc “Immune Booster” Tauri-Gum™ Flavor: Pear Bellini). The Company’s commercialization strategy consists of a broad array of retail customers, distributors, and a fast-growing E-Commerce business segment (E-Commerce website: www.taurigum.com). Please visit our corporate website, for additional information, as well as inquiries, at http://www.tauriga.com
Complementary to the Company’s retail business, are its two ongoing biotechnology initiatives. The first one relates to the development of a Pharmaceutical grade version of Tauri-Gum™, for nausea regulation (specifically designed to help patients that are subjected to ongoing chemotherapy treatment). On March 18, 2020, the Company announced that it filed a provisional U.S. patent application covering its pharmaceutical grade version of Tauri-Gum™. The Patent, filed with the U.S.P.T.O. is Titled “MEDICATED CBD COMPOSITIONS, METHODS OF MANUFACTURING, AND METHODS OF TREATMENT”. The second one relates to a collaboration agreement with Aegea Biotechnologies Inc. for the co-development of a rapid, multiplexed, Novel Coronavirus (COVID-19) test with superior sensitivity and selectivity.
On October 6, 2020, the Company announced that it has been approved to operate as a U.S. Government Vendor (CAGE CODE # 8QXV4)
On October 7, 2020 the Company disclosed a Strategic Alliance with Think BIG, LLC, Social Impact Startup Founded by CJ Wallace, Son of Christopher “The Notorious B.I.G.” Wallace.
The Company is headquartered in New York City and operates a regional office in Barcelona, Spain. In addition, the Company operates a full time E-Commerce fulfillment center located in LaGrangeville, New York.
DISCLAIMER — Forward-Looking Statements
This press release contains certain “forward-looking statements” as defined by the Private Securities Litigation Reform Act of 1995 which represent management’s beliefs and assumptions concerning future events. These forward-looking statements are often indicated by using words such as “may,” “will,” “expects,” “anticipates,” believes, “hopes,” “believes,” or plans, and may include statements regarding corporate objectives as well as the attainment of certain corporate goals and milestones. Forward-looking statements are based on present circumstances and on management’s present beliefs with respect to events that have not occurred, that may not occur, or that may occur with different consequences or timing than those now assumed or anticipated. Actual results may differ materially from those expressed in forward looking statements due to known and unknown risks and uncertainties, such as are not guarantees of general economic and business conditions, the ability to successfully develop and market products, consumer and business consumption habits, the ability to consummate successful acquisition and licensing transactions, fluctuations in exchange rates, and other factors over which Tauriga has little or no control. Many of these risks and uncertainties are discussed in greater detail in the “Risk Factors” section of Tauriga’s Form 10-K and other filings made from time to time with the Securities and Exchange Commission. Such forward-looking statements are made only as of the date of this release, and Tauriga assumes no obligation to update forward-looking statements to reflect subsequent events or circumstances. You should not place undue reliance on these forward-looking statements.
Contact:
Tauriga Sciences, Inc.
555 Madison Avenue, 5th Floor
New York, NY 10022
Chief Executive Officer
Mr. Seth M. Shaw
Email: sshaw@tauriga.com
cell # (917) 796 9926
Instagram: @taurigum
Twitter: @SethMShaw
Corp. Website: www.tauriga.com
E-Commerce Website: www.taurigum.com
Public Relations:
Email: press@tauriga.com
[ad_2]


